
Impacts of Choice Architecture on Vehicle Purchasing
By Kate Rack and Jenna Zhang, April 8, 2014
Understanding how to display fuel economy data on vehicle labels to promote environmentally friendly automobile purchases.
Researchers: Elke Weber, Eric Johnson, Rick Larrick, Christoph Ungemach, Adrian Camilleri
The MPG Illusion
Prior to 2013, vehicle labels featured only miles per gallon (MPG) data, which created misunderstanding on the actual fuel efficiency of the vehicle in question (Larrick & Soll, 2008). The “Miles Per Gallon Illusion,” as it is called, highlighted how consumers have trouble converting the MPG metric to gas consumption and cost. They assume that MPG and gas consumption have a linear relationship, making drivers believe that the difference in gas consumption between a vehicle with 10 MPG fuel economy to 12 MPG is the same as the gas consumption difference between 40 MPG and 42 MPG, which is incorrect. There is great value in a small increase in fuel efficiency in already inefficient vehicles (Figure 1). Figure 2 illustrates the differences in perceived and actual benefits of more efficient gas mileage.
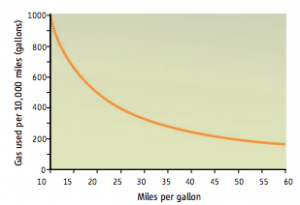
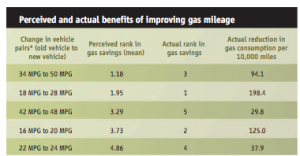
Figure 1 and 2: Relationship between MPG and gallons per 10,000 miles (left) and actual amount of gas savings (right). 1
To combat this confusion, changes have been made to vehicle labels to help consumers understand fuel economy and allow them to make better-educated purchases. The sticker now includes gallons per mile information and annual fuel costs to counteract the MPG illusion since consumers are not good at converting MPG to cost (Larrick and Soll 2008). The label still includes MPG, but has added annual fuel cost estimate, gas consumption per 100 miles, and greenhouse gas and smog ratings (Figure 3).
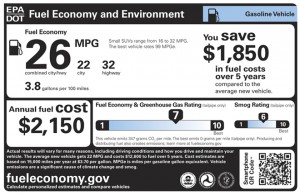
Figure 3: Current fuel efficiency labels, as issued by the US Department of Transportation with input from the Environmental Protection Agency in 2013.
Choice Architecture
With these new labels in mind, Adrian Camilleri and Richard Larrick conducted research that sought to understand how changing the information on vehicle fuel economy labels, metric and scale can help people make more informed choices, and what combination of information yields the strongest preference for fuel-efficient vehicles.
The research utilizes principles from the field of choice architecture, which states that choices are always made in context. People usually do not have a concrete and stable preference, but construct a preference every time they are asked to make a decision. Most people are influenced by the context of the situation; the term “choice architecture” refers to all of the tasks and features associated with a decision that influences what information is used and how it is processed. For example, a consumer might read a review of a product before purchasing. The person writing the review has the power to decide what attributes (characteristics of the object such as color and price) they will use to rate the product. The choice that the consumer makes is affected by how the product reviewer used specific characteristics to rate the product. Here, the reviewer is the “choice architect” and the characteristics chosen by him are components of “choice architecture.”
Camilleri and Larrick conducted two studies, testing 908 participants who chose between two vehicles that traded off on price and fuel economy. When given information on fuel economy, they changed the metric (gas consumption vs. cost of gas) and distance (100 miles vs. 15,000 miles vs. 100,000 miles) across different trials. 100 miles is what is currently used on the fuel efficiency label, 15,000 miles corresponds to miles driven in a year, and 100,000 miles is roughly the amount driven over the lifetime of a vehicle. In both studies, the fuel-efficient vehicle was more expensive. But, the cost of the vehicle in the first study, over approximately 100,000 miles, made up for the initially higher price. This means the fuel-efficient vehicle paid for itself over the lifetime of the vehicle. In the second study, the fuel-efficient vehicle paid for itself in half of the situations but not in the other half.
The key finding of this research is that consumers choose fuel-efficient vehicles more often when fuel economy is expressed in terms of cost of gas over a longer time frame- the 100,000-mile scale. This is significant because this is not expressed on the current vehicle labels.
Main Findings
Product labeling is an important public policy tool. The way that information is framed can help to reduce green house gas emissions by encouraging pro-environmental behavior that is also economically beneficial for the consumer. Currently, fuel economy labels do not include information regarding the cost of gasoline over 100,000 miles. However, including this could be an easy and effective way to encourage consumers to choose fuel-efficient vehicles. MPG alone, and the cost of gasoline over 100 miles do not give enough information.
Additional Links:
1Larrick, R. P., & Soll, J. B. (2008). The MPG Illusion .Science, 320, 1593-1594. Available here.
Camilleri , A. R., & Larrick, R. P. (2013). Metric and Scale Design as Choice Architecture Tools. Journal of Public Policy and Marketing: Spring 2014, Vol. 33, No. 1, pp. 108-125 Available here.
For more information on the larger project that this study is a part of click here.
A short video explaining choice architecture and this study can be found here.
An additional blog post on this same topic can be found here.